Objectives of the Dashboard
The A2F Interactive dashboard is a population-based interactive platform for analyzing key
indicators from the Access to Financial Services in Nigeria Survey across different years. By
enabling users to explore and compare data from 2018, 2020, and 2023, the dashboard aims
to facilitate informed decision-making and strategic planning based on trends and insights
derived from the available data.
Specifically, the dashboard aims to achieve the following objectives:
- Data Analysis and Comparison: Enable users to analyze and compare key indicators
over multiple years to identify trends, patterns, and changes over time. - Demographic Insights: Allow users to dissect data based on various demographic
characteristics such as region, state, age range, sector, gender, and target group,
providing insights into different population segments. - Granular Analysis: Provide the ability to drill down into sub-indicators for a more
granular analysis, offering deeper insights into specific aspects of each primary
indicator. - Informed Decision-Making: Empower decision-makers with actionable insights
derived from the dashboard's data visualization and analysis capabilities, supporting
evidence-based decision-making processes. - User-Friendly Interface: Offer an intuitive and user-friendly interface that enhances
usability and accessibility, enabling users to navigate through the dashboard
effortlessly and derive insights efficiently. - Enhanced Data Visibility: Improve the visibility and accessibility of key data points
and trends, fostering transparency and accountability in data-driven decision-making
processes.
If you have any additional questions reach out to us at info@efina.org.ng.
While the dashboard offers valuable insights into select indicators, it is important to note that
it complements rather than replaces the main dataset, which contains a broader range of
indicators not currently covered in the dashboard.
The link will guide you on how to navigate the Interactive Dashboard.
The dashboard is divided into seven pages, each offering unique insights into various aspects
of financial inclusion.
- Page 1: Headline indicators
This page showcases headline indicators that track access to financial services in
Nigeria. This section covers both the famous access strand – a mutually exclusive
indicators that segments the population into 4 groups of banked, other informal,
informal only, and excluded. Additionally provides insight into banked individuals (as
a sum total of Nigerians who are using banking services regardless of whether they
are using other type of financial services). Other formal users (a sum total of
Nigerians who are using other formal financial services regardless of if there are using
these services in combination with other financial services), this is likewise for
informal users while excluded are those who are using none of the financial services
and products.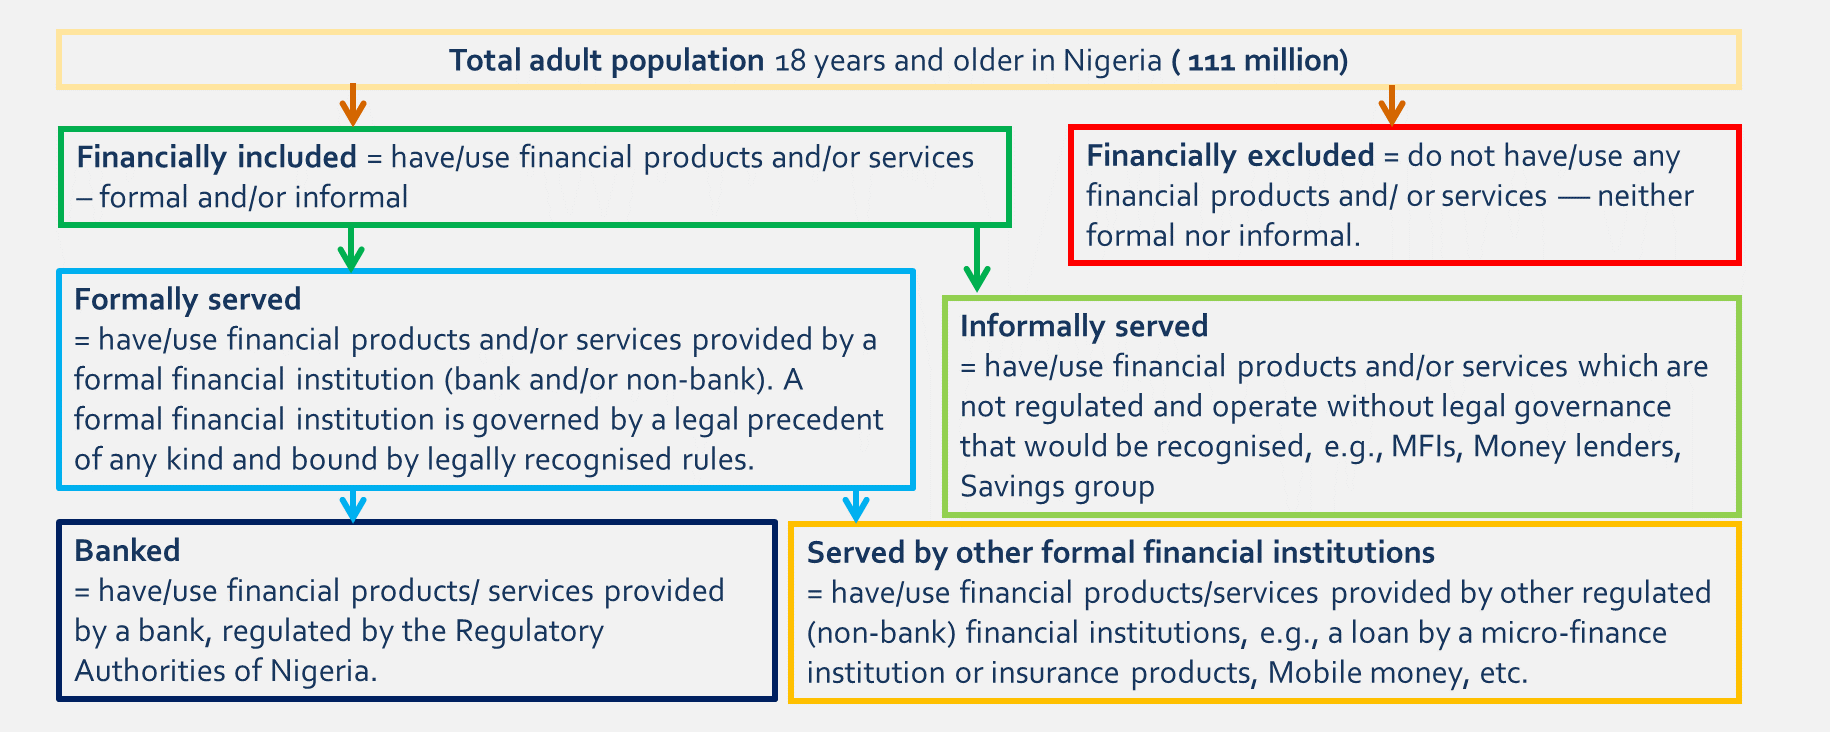
- Page 2: Usage of Financial Services
This page delves into the usage of savings, credit, insurance, pension, and remittances by various providers, offering insights into the breadth and depth of financial service utilization across different segments of the population. - Page 3: Financial capability
This page explores the financial capability of Nigerians, shedding light on their knowledge, skills, attitudes, and behaviors concerning financial management and decision-making. - Page 4: Financial health
This page explores the financial health of Nigerians, examining factors such as income stability, debt management, savings habits, and access to emergency funds. - Page 5: Challenges and Barriers
This page explores challenges in the use of specific financial products and services, as captured in the A2F survey. These challenges encompass borrowing, saving, using bank accounts, accessing insurance, and preparing for retirement. - Page 6: Factors influencing Adoption
This page explores factors that would encourage Nigerians to utilize certain financial services, including financial service agents, mobile money, and microinsurance, offering insights into strategies for promoting service uptake and usage. - Page 7: State-wide view
This page provides a statewide view of selected indicators, allowing users to analyze regional variations and disparities in financial inclusion and capability across different states in Nigeria.
See more details of the pages through this link
How to use the Dashboard
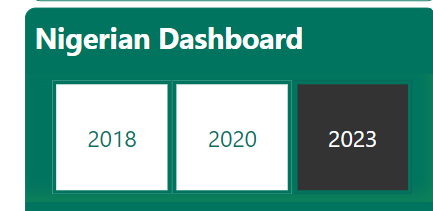
Step one: Select year
Begin by selecting the specific year you want to analyze from the available options: 2018, 2020, and 2023. Note that not all indicators may be available for every year.
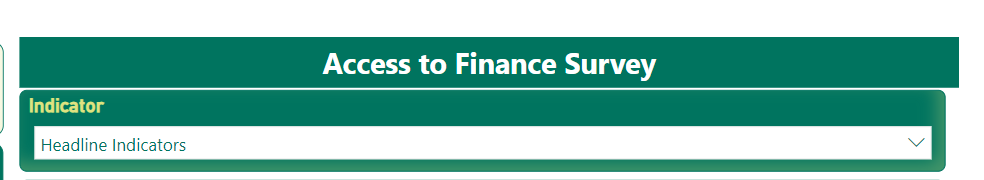
Step 2: Choose the indicator
Select the primary indicator (labelled indicator) you wish to analyze. This indicator will serve as the basis for all subsequent analyses. You can choose from the list of available indicators displayed across the seven pages of the dashboard.
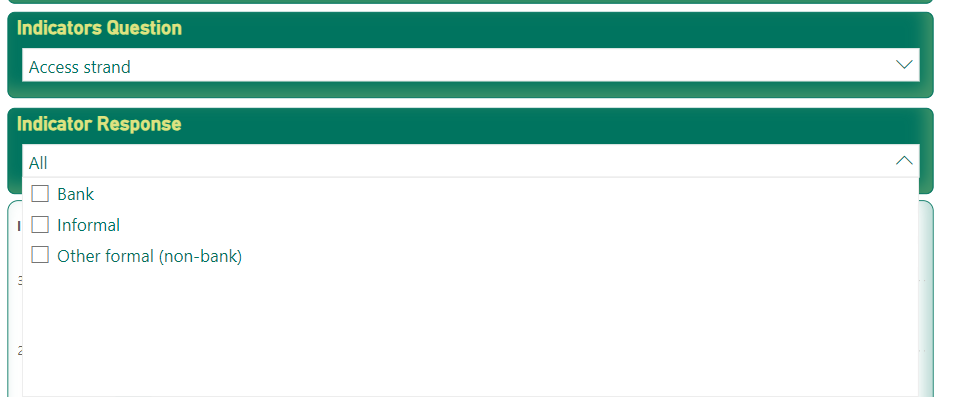
Step 3: Explore sub-indicators (if applicable)
Some indicators may have sub-indicators for more detailed analysis. Navigate to the “Indicator Question” section and select the specific sub-indicator if applicable.
Refer to the accompanying table to distinguish between core indicators and sub-indicators. Each sub-indicator will have its corresponding response, providing further granularity to your analysis.
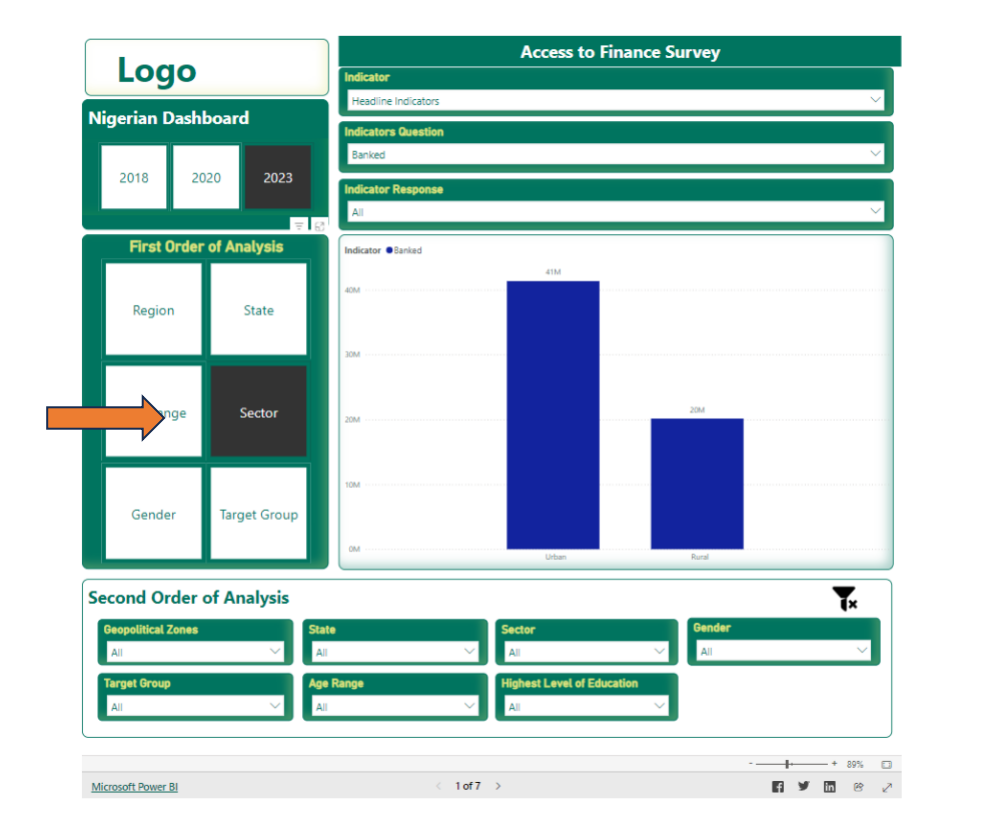
Step 3: Conduct Analysis
First Order of Analysis:
Analyze the selected core indicator based on various demographic characteristics such as region, state, age range, sector, gender, or target group.
For example, you can inquire about the how many banked Nigerians are living in the urban areas in 2023 – the figure below shows that 41m banked Nigerians are living in the urban areas.
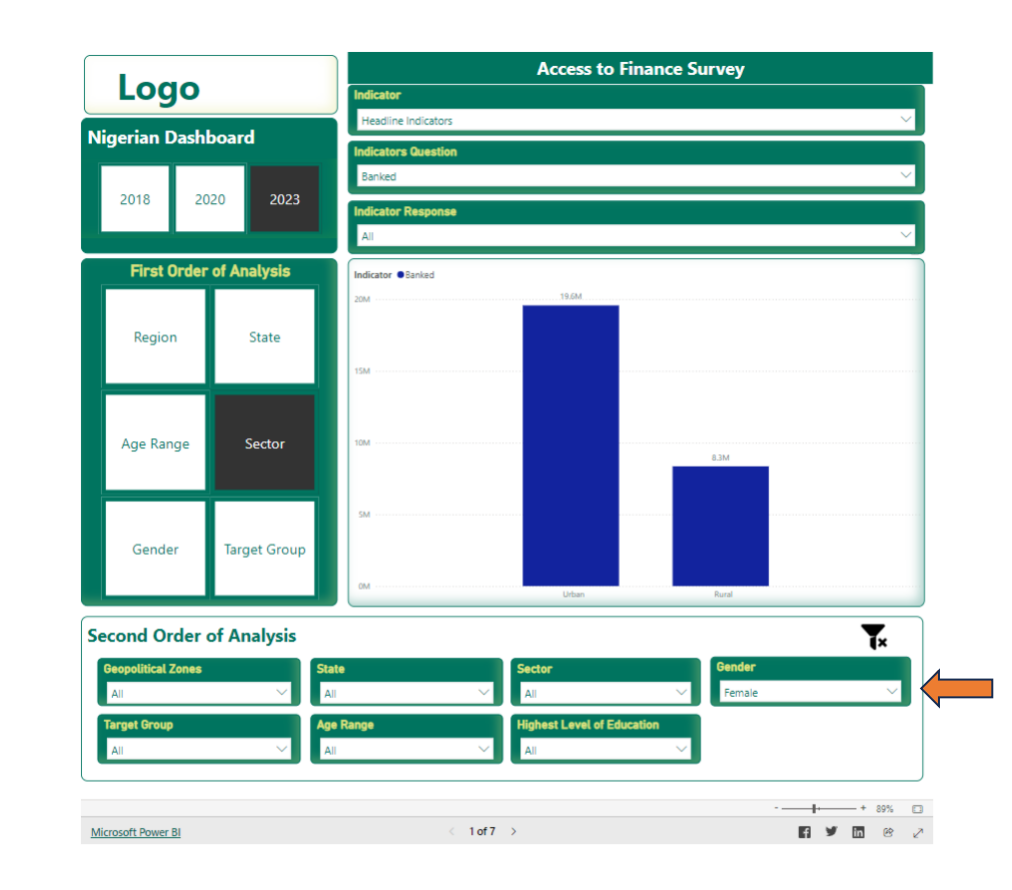
Second Order of Analysis: you can further refine your analysis further by exploring additional demographic details. For instance, you can determine how many of the previously identified urban, banked Nigerians are female.
In this example we can see that it is 19.6m urban banked Nigerians are female
Do not forget to turn off the slicer at every step if you wish to switch from one indicator to another. See image of the slicer below.